The YPulse platform

If young people do it, buy it, watch it, play it, or think it, we ask about it.

YPulse is a syndicated youth research platform built on one audience: 8-39-year-olds in North America and Western Europe, surveyed weekly. See the trends before they happen
YPULSE BY THE NUMBERS

8-39

Age Range

400K+

Interviews annually

60+

Survey and report topics annually

21B+

Total datapoints
(3B added annually)

7

North American and European countries

1,200

Brands tracked

This is the toolkit that changes how you do youth research.

AI-Powered Access

Don't just get answers about Gen Z. Get answers you can trust.

Sure, you can ask ChatGPT, but no LLM has access to our +21 billion datapoints and insights on 8-39-year-olds. Ask YPulse AI the way you’d ask a colleague: how teens feel about buying secondhand, what’s driving thrifting in Western Europe. When we haven’t fielded something, it tells you instead of guessing, unlike most LLMs.

Closed corpus

Answers only from our +21 billion datapoints on youth. No slop from the open internet.

Every answer is sourced

Each response cites the survey data and question that produced it.

The whole archive at once

One question searches every report, article, survey data row, and brand tracker wave.

Your AI or ours

Ask YPulse AI directly, or connect your company’s LLM and ask there. Read more about YPulse MCP.

✦ Ask anything about young consumers

Where did young consumers last see an ad that made them want to buy something?

Social media is still the top place 13-39-year-olds say they last saw an ad that made them want to buy something: 47% of 13-17-year-olds, 50% of 18-24-year-olds, and 39% of 25-39-year-oldsAd / Marketing Effectiveness 2026

YouTube, asked about separately from social media this year, comes second at 27%, 29% and 34%. Combined, social and YouTube account for 75% of ad influence among young consumers.

Video is what drives that influence: 75% of teens and 74% of 18-24-year-olds prefer a YouTube video over a traditional commercial, and 79% of teens prefer an ad in a social media video over a photo.

Below social and YouTube, streaming service commercials follow at 16% to 21%, then music streaming and in-game ads. Worth flagging for planning: 9% of teens and 14% of 25-39-year-olds say they don’t pay attention to a brand’s marketing at all.

Ad / Marketing Effectiveness 2026 Behavioral data Report takeaways Survey question

✦Chart

Top places 13-39-year-olds last saw or heard an ad that made them want to purchase something

North America · February 2026 · n=1500

13-17 18-24 25-39
Social media
47%
50%
39%
YouTube
27%
29%
34%
Streaming service commercial
16%
19%
21%
✦Source

Ad / Marketing Effectiveness behavioral report

North America · April 2026

Survey question, as fielded

Think of the last ad you saw or heard that made you want to purchase something. Where did you hear or see it?

Answer
Social media
Audience
13-39-year-olds
Base
n=1500, U.S. and Canada
Fielded
19-27 February 2026
✦What this means for brands
1

Social media is where discovery happens, but YouTube drives deeper engagement and intent. Build campaigns that ladder from short-form to long-form video.

2

Make ads that blend into the feed. Content that looks like a regular post or something unscripted will outperform polished, obvious ads.

3

Prioritize video across everything. Video is consistently preferred over images, even for campaigns that would traditionally rely on posed photography.

✦Every finding cut by
13-1718-2425-39 MaleFemale POCWhite / non-Hispanic LGBTQ+ ParentsMoms / Dads Middle / high schoolCollegeNot in school U.S.Canada Big citySuburbsRural Household income + more
X NA_2026_Ad-Marketing-Effectiveness_Data.xlsx
QResponse13-1718-2425-39U.S.CA
A100Social media47%50%39%44%46%
A100YouTube27%29%34%31%29%
A100Streaming service commercial16%19%21%19%18%
A100Music streaming ad17%13%13%14%15%
A100 A105 A110 Banner points
Brand Tracking

See your brand the same way Gen Z does.

Brand Tracker scores your brand on the 20 measures young people actually decide with: Cool, Trustworthy, Gets You, and more. That turns a score into a diagnosis: you don’t just learn you’re slipping with Gen Z, you learn which measure moved and what to do about it.
Built for young respondents

Every diagnostic is written and tested for 13-39-year-olds, not borrowed from an adult tracker.

Trendlines back to 2018

Many of our 1,200+ brands have been tracked since then, so you see movement, not a snapshot.

Cut it your way

Age, gender, race and ethnicity, parents, gamers, LGBTQ+, region, education, and household income.

Base sizes that hold up

With 5,000 interviews each week, you get stable base sizes that you can rely on. 

Behavioral Intelligence

Know what's about to hit your category before it does.

Young people don’t live in your category, so the change that hits it next year usually starts somewhere else: what they’re watching, eating, and playing. YPulse publishes a different behavioral report every week, across 40+ categories. Read your own for depth, and the ones next to it for what’s coming.

Over 40 categories a year

A new behavioral report lands almost every week, each on a different category.

The same study, every year

Recurring monitors re-field annually, so the trend charts run back to 2017.

Every finding cut by life stage

Reported for 13-17, 18-24, and 25-39, with spotlights on parents, people of color, and LGBTQ+ respondents.

Everything behind the report

Each report ships with its Excel data file, plus dashboard access and AI access.

Cultural Trends

Know what to do about the trend.

Every trend report pairs what’s changing with young consumers with what your brand can do about it. We cover 12 trend topics a year, with brand callouts throughout each one, so your team leaves with next moves as well as findings.

Moves, not just findings

Each trend ends with specific actions, like making how-to content searchable or seeding lore on Reddit months before a launch.

Brands already doing it

See how brands like Spotify, Airbnb and Netflix are responding, so you can borrow what’s working.

The story on page four

A TL;DR gives the full picture in minutes. The chapters back each point with survey data.

Everything behind the report

Each report ships with its Excel data file, plus dashboard and AI access.

add tween insights

See the 8-12-year-olds your other tools can’t.

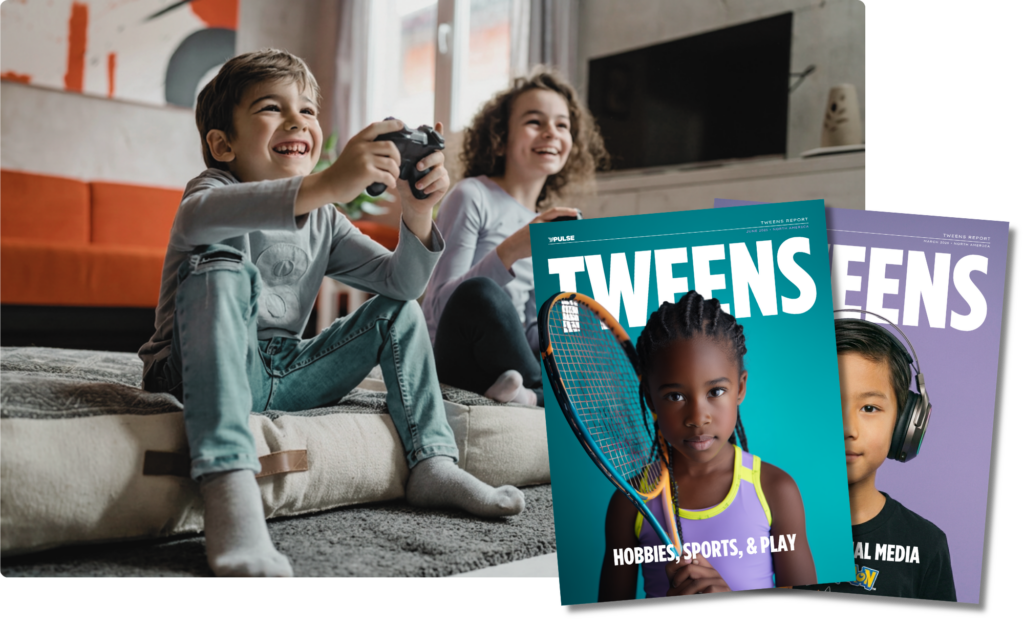
Researching 8-12-year-olds is hard enough that almost nobody does it, which is why Gen Alpha is a blank space in most brands’ data. Tweens Insights fills it: eight reports a year on 8-12-year-olds in North America, the only syndicated read on this group.

Made for Spotify
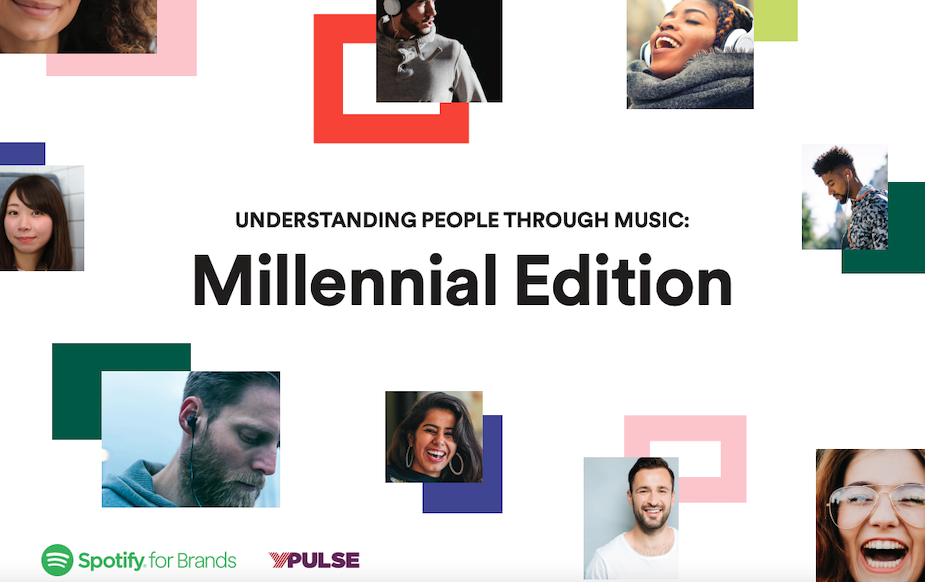
Cover of Understanding People Through Music, the Millennial Edition white paper YPulse researched for Spotify.
CUSTOM RESEARCH

Got a unique challenge?

The Studio, our custom research team, designs and manages bespoke studies of all sizes to answer your questions about Gen Alpha, Gen Z, and Millennials. Bring us an RFP or just the question, and we’ll build the research around it.

Enterprise PLANS

Choose the right plan for your organization.

YPulse is an annual enterprise subscription. We offer two robust plans to meet your needs.

Prime

Every article, behavioral report, and trend report we publish, with the survey data and YPulse AI behind them. Use it to catch shifts in your category early and answer “what do young people think?” with a number you can source.

Pro

Everything in Prime, plus the Brand Tracker with your competitive set included. Use it to see how your brand scores against its competitors, and to ask YPulse AI about any target group you define, including cuts we haven’t published.

Enter your colleagues' emails (max 10) to invite them to sign up for a YPulse account. We'll send them a message and let them know you invited them.

plus-circle Created with Sketch Beta.

Are these emails correct? If so, click Submit Invitation(s)?